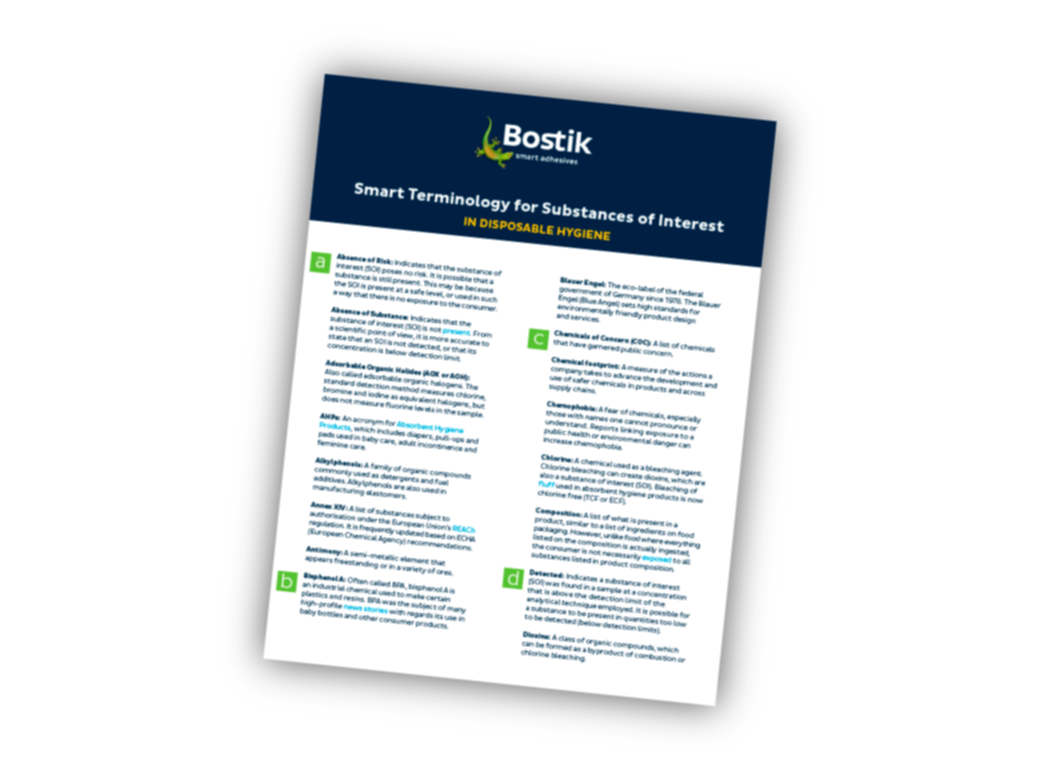
Evaluating Presence, Exposure, and Risk of Substances of Interest
To help you better understand the evaluation of presence, exposure, and risk of Substances of Interest (SOIs) in absorbent hygiene products, we have prepared the following example using two relatable items:
- An everyday sugar cube
- An Olympic-size swimming pool
Through this explanation, you may also learn additional terms that are often a part of discussions about SOIs.
A brief note before we begin: We recognise that many SOIs have a health and safety risk associated with them. However, we intentionally chose sugar as our example—a substance that is not usually considered harmful or toxic. This will help us explore the topic objectively, with a scientific perspective. Also, in this example, only oral exposure is considered while in more complex situations, dermal and/or inhalation exposures can also be considered in the risk assessment.
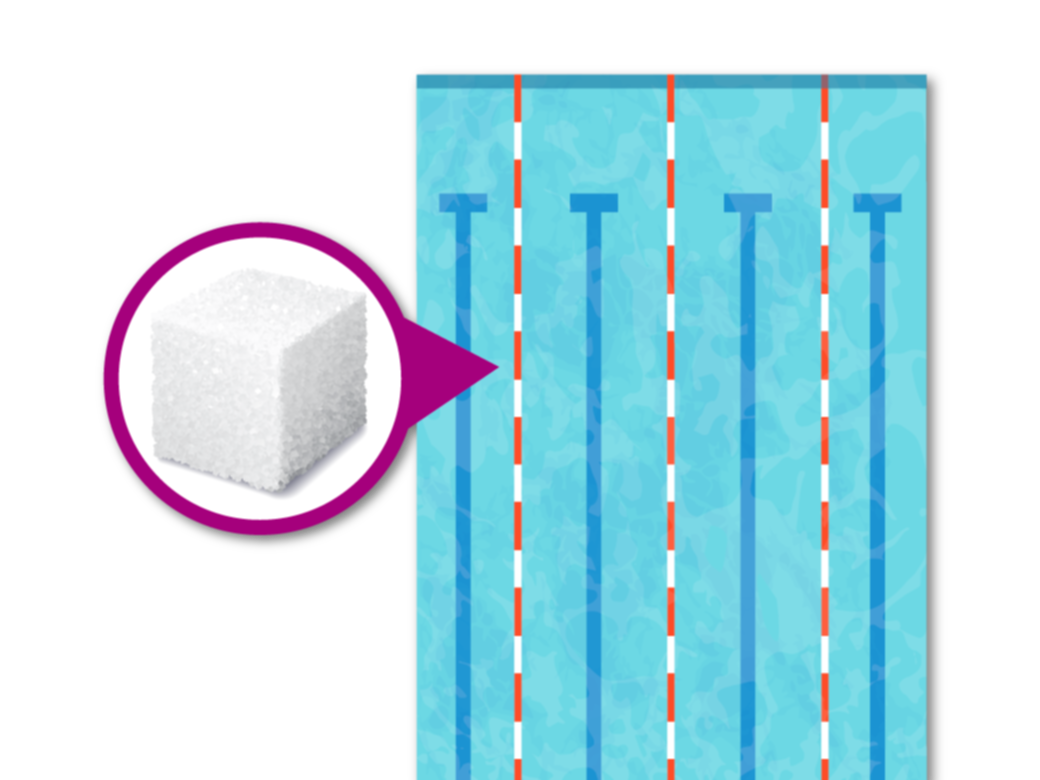
Defining ‘traces’ and what a part per billion (ppb) represents
Some reports list the presence of SOIs in ppb, or parts per billion (corresponding to a ratio of 10-9, i.e. 1 µg of SOI/kg of product). This can be illustrated by the case of our sugar cube diluted in an Olympic-size swimming pool. The ppb concentration is calculated using the following process:
- One sugar cube is 6 grams
- An Olympic swimming pool is 50 metres in length, 25 metres in width, and a recommended 2 metres minimum in depth
- 50m x 25m x 2m = 2,500 cubic metres in volume. This equals 2,500,000,000 cubic centimetres
- Because 1 cubic centimetre of water = 1 gram of water, the pool holds 2,500,000,000 grams of water
- The sugar concentration in the swimming pool is 6 grams of sugar ÷ 2,500,000,000 grams of water = 2.4 ppb
To sum up, if we dilute a sugar cube in an Olympic-sized swimming pool, the sugar concentration in the water is 2.4 ppb.
Demonstrating presence through concentration measurement
In order to demonstrate PRESENCE of sugar in the pool, we would take a sample of the water and use an analytical technique to measure concentration. Because of familiarity with our procedures, we would also know the test’s limit of quantification and accuracy. In other words: the smallest unit it could measure and the margin of error. In this example, we could say:
‘We have measured sugar concentration in this pool and found it to be 2.5 ppb, with method XYZ that has a minimum of quantification of 0.1 ppb and a margin of error of 30%.’
Considering sources of contamination
Before we share information about exposure, we should first discuss the issue of CONTAMINATION.
The sugar cube in our example could have been added to the pool as part of the water treatment program. This would be referred to as being intentionally added.
An equivalent amount of sugar could also end up in the water accidentally. For example, several people may have had a doughnut and did not wash their hands before entering the pool. The sugar would then be present because of contamination.
Contamination can also occur in the testing process. For example, the person in charge of taking a water sample for lab analysis may have put the sample in a container that recently held sugar. Even if they had rinsed the container many times, traces of sugar may still be present, contaminating the new sample. Given that the sample is so much smaller than a pool, it takes only the smallest trace of sugar to measure at 2.5 ppb.
Based purely on the test results, there is no way to know if the sugar concentration is intentional or from contamination in testing or at the source. This is one reason why it is so important to understand testing procedures and potential sources of contamination both in the process and during testing.
Determining toxicity
Many substances identified as being of concern to human health and the environment have been evaluated to determine their toxicity. In particular, the REACH regulation (Regulation, Evaluation, Authorisation, and restriction of Chemicals) allowed this through the registration of substances placed on the EU market. The communication of this information throughout the supply chain will be done by the Safety Data Sheet (SDS) containing information about the hazards (physical, health, environmental, and additional hazards) and advice on safe use at work.
With only this information at hand, all we can establish is ‘presence’, and ‘toxicity’. We cannot yet make any scientific claims about exposure and therefore risk.
Determining exposure levels
EXPOSURE is based on understanding the following factors:
- What is the population that may be at risk from contact with the substance
- Concentration of the substance
- What is the main route of exposure (dermal and/or oral absorption or by inhalation)
- How can individuals be exposed
- For how long can they be exposed
- How often can they be exposed
Going back to our example of the sugar in the pool, the population at risk might be individuals with type 1 diabetes who go swimming. They could be adults or children, male or female, healthy or frail. Considering they have a risk when ingesting sugar, people walking around the pool are not exposed. People swimming in the pool, and accidentally swallowing pool water, are exposed.
The exposure scenario should include studies where scientists determined:
- How often people go to the pool to swim per year
- How long they stay in the water
- How many times they open their mouths in the water
- How much water is swallowed when they open their mouths
- What is the body weight of the average swimmer
We would next make calculations based on these statistics and the sugar concentration present in the water. Together, they allow us to determine the amount of sugar per kilo of body weight per day that someone could swallow. This is the EXPOSURE LEVEL.
Measuring the level of risk
Risk assessment is the comparison between the toxicological reference value and the potential exposure of the user
For example, when a certain amount of sugar is in the body of an individual with type 1 diabetes, this person is at risk for cardiac problems, cognitive issues, etc.
Toxicologists can calculate the toxicological reference value (in our example, by determining the maximum admissible dose of sugar per day for individuals with type 1 diabetes).
To understand if there is an actual risk, the exposure level (the potential amount of sugar swallowed calculated in the exposure scenario) is compared to the toxicological reference value (the maximum admissible dose). If the exposure level is higher than the toxicological reference value, then there is a risk for the health of the users and the pool could be shut down while the situation is studied to decrease the exposure level.
Making assumptions and ‘worst case’ scenarios
In any scenario, assumptions are made. In this case, assumptions include that individuals with type 1 diabetes and the general population go to the pool with the same frequency, and they have the same patterns of behaviour.
In addition, it is not uncommon to make calculations based on ‘worst case’ scenarios. This involves assuming things are worse than they probably are. For example, only skinny individuals go to the pool and swim all day long, every day. Another assumption may be that the amount of water swallowed when swimming is several litres. This ‘worst case’ scenario can lead to an overestimated exposure level.
Similar issues may arise in the determination of the toxicological reference value. Staying with our pool example: Scientists may have used test results where the sugar was directly injected into the blood stream because there were no drinking water studies done with sugar. The hazard from swallowed water might, in fact, be less than injected sugar. This can lead to a stated hazard level higher than the actual risk.
When these two assumptions come into play at the same time—an overestimated exposure level and an underestimated admissible dose level—a situation can arise in which the risk appears greater than it is. But to be safe, a reporting organisation may state in their findings, ‘risk could not be excluded’.
As demonstrated by our sugar cube in an Olympic-size swimming pool example, there are many components to accurately determine presence, exposure, hazard, and risk. To summarise:
- When demonstrating presence of SOIs, it is important that testing procedures are clear. This allows us to understand their precision, margin of error, and any risks of contamination.
- When determining toxicological reference values, it is important to understand assumptions that are made in calculations, as well as how the hazard level may vary by segment of the population.
- When determining exposure level, it is important to understand the population at risk and their behaviour as it relates to products and the location of the SOIs.
- Determining actual risk requires comparing the exposure level to the toxicological reference value. Presence alone does not constitute risk.
By utilising the methods outlined above, we can accurately evaluate whether the presence of a substance of interest does or does not pose a risk to human health. Until then, little more can be said other than ‘we found it’.
CODE: SOI-21A05
SOI Materials from Bostik Academy
Click the links below to sign-in and access all of our Academy materials.